John Gorlow
| Mar 07, 2017
Do Deficits Matter?
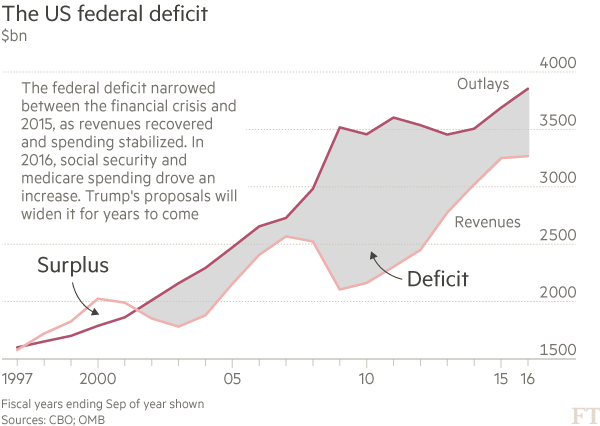
The president’s recent inaugural speech to Congress had an unusually reassuring tone. But the speech raised one alarm after another for deficit hawks and anyone else still hoping that Mr. Trump would slash spending. The fear is that big-ticket plans like Mr. Trump’s lead to big deficits that dampen economic growth and drive down returns. That’s the conventional wisdom, anyway. But is it true? ?
Not necessarily so, according to a 2010 research report by Marlena Lee and Dimensional Fund Advisors. In a nutshell, the DFA study finds no evidence that deficits are predictive of future equity and bond returns. It’s a random walk, in fact. So investors may be fine, even if Mr. Trump gets Congress to approve a massive spending spree. In his recent speech he mentioned more military spending, expanded childcare and paid family leave, Medicaid support for the poor, a huge investment in infrastructure, and a health plan that covers everyone. A 1-March Financial Times Op-Ed summed it up: “… every word that came out of Trump’s mouth was expensive.”
Spending. Deficits. And your investment returns. These are big issues to consider, and we’ll provide more detail about DFA’s study in a moment. But first, the February numbers.
February Market Report
Global stocks produced their fourth consecutive monthly gain, capping their longest winning streak since mid-2014. The S&P Global Benchmark Index (BMI) added 2.60% after January’s 2.67% gain, resulting in a 5.33% YTD return. This was night-and-day different from the precipitous -7.07% decline in the first two months of 2016. The one-year return for the BMI was an impressive 20.25%, or 16.66% minus the 23.71% gain from the US
US Stocks: The S&P 500 continued its upward climb and set nine new closing records. The record-filled month translated into a broad 3.72% gain (3.97% with dividends), bringing the index up 5.94% YTD (with dividends); up 11.22% (with dividends) since the November 8 election; and up 24.98 (with dividends) for the one-year period. The S&P SmallCap 600 climbed 1.47% after last month’s -0.45% decline, resulting in a 1.02% YTD gain and a 33% return for the trailing one-year period.
Emerging Markets: Emerging Markets began 2017 with an unexpected surge of optimism bolstered by low valuations and the prospects for a new cycle of rising profits. And again the category did better than developed markets, making up for its subpar post-election 2016 performance (November 8 through December 31, 2016). The group posted a 3.37% gain for the month, with 17 of the 22 markets posting gains. Egypt did the best, adding 12.36% for the month but still down -1.77% over one year. India was next, up 6.55% for the month and up 12.25% YTD. Brazil added 4.44% in February, and was up 15.68% YTD. Russia did the worst for the month, off -5.63%, which turned it negative -4.20% YTD, but remained up 13.00% since the U.S. election. YTD at the end of February, emerging markets were up 8.64% YTD, with a one-year gain of 26.91%, but were still in the red over the two-year period at -3.95%.
International Developed Stocks: Though developed markets did less well than emerging markets, 21 of the 25 markets were up in February, adding 2.51% for the month, or 1.23% absent the 3.47% gain from the US. Year-to-date, developed markets were up 4.99%. Luxembourg did the best (up 9.08% for the month and 10.29% YTD), followed by Israel (up 5.18% and 7.44% YTD), and the US (up 3.47% and 5.38% YTD). On the down side, Norway declined -2.16% in February but remained up 3.57% YTD, followed by Canada, which declined -1.44% but was up 2.10% YTD. In February, Japan gained 1.55%, the UK was up 1.38%, Germany added 0.60%, and France was up 0.23%. Since the November 8, 2016 US election, developed markets were up 8.94%, but excluding the 11.13% gain from the US, they were up 6.05%, still good.
Commodities: The broad Bloomberg Commodity Total Return Index marked time in February, remaining roughly unchanged YTD in 2017. For the month, the Precious Metals sub-index, up 3.9%, led all sectors, with the Industrial Metals sub-index close behind, up 2.2%. The Energy sub-index fell -2.7%, and soft commodities (coffee, cocoa, sugar, corn, wheat, soybeans, fruit and livestock) were the worst performing sub-index, dropping -4.7%. Grains were up 1.6% and agriculture was flat. Silver led all Index components, returning 4.9% for the month and finishing up 15.2% YTD, slightly ahead of its 14% 2016 return. Spot gold jumped 3.6% for the month and at the end of February returned 8.7% YTD, besting its 7.7% return for all of 2016. Energy prices remained under pressure, with the Energy sub-index finishing February down -10.1% YTD. Still, the category maintained a solid 15.95% return for the trailing one-year period.
Fixed Income: While equity market momentum continued in February, interest rates dipped across the US fixed income yield curve, setting up an interesting contradiction. The bond market is indicating that little belief that the President's pro-growth, lower tax, light regulation agenda will produce results as dramatic as what's already reflected in current stock prices. With the bond market flashing a warning sign and simultaneously supporting equity valuations, a sharp rise in bond yields, which many fear, could easily cause equity risk to be re-priced. The yield on the 5-year Treasury note declined five basis points to close at 1.89%. The ten-year T-Note yield decreased 9 basis points, finishing at 2.36%. The 30-year Treasury Bond yield shed 7 basis points to end at 2.97%. The 1-year and 2-year T-Bill yields were more or less unchanged at 0.88% and 1.22% respectively. Short-term investment grade corporate bonds gained 0.43%. Intermediate-term investment grade corporate corporates returned 1.13%. Short-term municipal bonds added 0.33%. Intermediate-term municipal bonds returned 0.67%. Intermediate-term high yield bonds returned 1.12% for the month.
Feature: Do Deficits Matter?
In 2010, Marlena Lee with Dimensional Fund Advisors looked at economic theories as well as historical evidence to try to sort out the effects of government debt on things like interest rates, economic growth, exchange rates and investment returns. The answers to all these questions are interesting, she says, but they don't have useful investment implications unless current debt levels or current deficit levels also tell us something about future expected returns or future exchange rate movements.
Here is a partial transcript of Ms. Lee’s presentation:
The first thing we'll look for is evidence that deficits tend to crowd out private investment through higher interest rates. What the empirical evidence shows is that long-term interest rates are higher when expected deficits are high. But statistical tests also show that information we have about today's deficits and today's debts do not predict anything about tomorrow's yield curve or tomorrow's bond returns.
The next logical question is whether or not crowding out effects in terms of higher interest rates has any impact on future GDP growth. The historical data suggests that high deficits might be producing some headwinds as far as future economic growth, but that slow economic growth is not necessarily guaranteed. And even if future GDP growth is slow, this doesn't necessarily mean the equity returns are going to be low. Furthermore, historical data also shows that there is no statistical difference in the stock returns of high-growth countries versus low-growth countries.
The final piece of the puzzle is whether we borrow more from foreigners when there are fiscal deficits and whether or not this has any implications for the dollar. For example, it's commonly believed that large fiscal deficits cause currency depreciation. As governments run large fiscal deficits, investors become worried about things like inflation risk and default risk, thus making currencies less attractive. As investors flee from these currencies, it causes the currency to decline. But it’s not clear when looking at historical data that this is the case. So the finding that fiscal deficits and trade deficits do not predict future exchange rate movements should not really be that surprising in light of findings of other academic studies.
Meese and Rogoff wrote a paper in the 80s, and they looked at all of the exchange rate forecasting models that were developed in the 70s. And what they found was that a simple, random walk model outperformed all of these forecasting models. Recall that a random walk model just says that the best forecast for exchange rates is the exchange rate today. Twenty-five years later, Rogoff found a new grad student to update the study, and they found very similar results. So 25 years of new data, new statistical techniques, and still what they found was that many of these exchange rate forecasting models just couldn't reliably out-predict a simple random walk model.
To conclude, we have uncovered some worrisome links between deficits and long run economic growth. Does this mean we entering into a period of a new normal? Perhaps. However, investment implications are much harder to come by. We haven't uncovered any evidence that deficits can predict future bond or equity returns.
Which Path to Follow?
As investors, we sometimes believe things that evidence does not support. Our beliefs are often reinforced by seemingly logical arguments about how the markets work (or should work).
Following the 1987 stock market crash, an article in the Q4 1988 Economic Review summed up a popular point of view similar to what we’re hearing today: “Some analysts claim that large federal budget deficits contribute to stock market crashes. These analysts argue that chronically large budget deficits and the corresponding need to attract a continuous inflow of foreign capital inevitably led to the run-up in long-term interest rates…[making bonds] increasingly attractive relative to stocks. In this view, failure to make satisfactory progress in reducing deficits was ultimately to blame for the stock market crash.”
On the opposite side of this viewpoint was Milton Friedman, who dismissed much of the discussion linking deficits to the market crash as “Reliance on economic fallacies'' (also from the Q4 1988 Economic Review).
You do not have to take a side. There aren’t clear-cut answers about the effects of budget deficits on stock prices. What you can assume is that stock and bond prices reflect all that is currently known and expected about government spending, debt and economic growth. And economic history demonstrates that expected market returns over the long term must be positive.
Sometimes we have to live with market worries and still have the fortitude to “do nothing.” Burgeoning budget deficits in the US and around the world are real. But setting an investment course based on how those deficits might affect interest rates, the economy or currencies is not a viable pathway to building long-term wealth. Why? Because as surely as we believe a certain scenario will unfold, the markets will confound us and move in another direction. Then we’re left holding a bag of wrong guesses.
A better option is to remain broadly diversified, with personal goals and risk tolerance reflected in asset allocation. Then rebalance periodically.