John Gorlow
| Apr 08, 2019

The surging popularity of index funds—and the corresponding exodus from actively managed funds—is a worrisome trend for Wall Street. And so the bankers and brokers and analysts have responded with dire predictions. The warning goes like this: as use of passively managed index investing grows, market prices will become distorted as fewer shares are traded and “price discovery” becomes more difficult. That’s bad news for markets and investors too. Should you be concerned? Let’s look at the evidence after reviewing Q1 quarterly returns.
First Quarter 2019 Market Review
Courtesy of Dimensional Funds
World Asset Classes
Equity markets posted positive returns around the globe in the first quarter. Looking at broad market indices, US equities outperformed non-US developed and emerging markets. Small caps outperformed large caps in the US and non-US developed markets but underperformed in emerging markets. Value stocks generally underperformed growth stocks in all regions. REIT indices outperformed equity market indices in both the US and non-US developed markets.
|
World Asset Classes
|
QTD
|
|
Dow Jones US Select REIT Index
|
15.72
|
|
Russell 2000 Index
|
14.58
|
|
Russell 3000 Index
|
14.04
|
|
Russell 1000 Index
|
14.00
|
|
S&P 500 Index
|
13.65
|
|
Russell 1000 Value Index
|
11.93
|
|
Russell 2000 Value Index
|
11.93
|
|
S&P Global ex US REIT Index (net div.)
|
11.73
|
|
MSCI World ex USA Small Cap Index (net div.)
|
10.93
|
|
MSCI World ex USA Index (net div.)
|
10.45
|
|
MSCI All Country World ex USA Index (net div.)
|
10.31
|
|
MSCI Emerging Markets Index (net div.)
|
9.92
|
|
MSCI World ex USA Value Index (net div.)
|
8.49
|
|
MSCI Emerging Markets Value Index (net div.)
|
7.83
|
|
MSCI Emerging Markets Small Cap Index (net div.)
|
7.76
|
|
Bloomberg Barclays US Aggregate Bond Index
|
2.94
|
|
One-Month US Treasury Bills
|
0.58
|
|
As of 3/31/2019
|
|
US Stocks
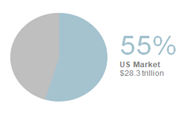 US equities outperformed both non-US developed and emerging markets. Small caps outperformed large caps in the US. Value underperformed growth across large and small cap stocks.
|
Ranked Returns for the Quarter
|
%
|
|
Russell 2000 Growth Index
|
17.14
|
|
Russell 1000 Growth Index
|
16.10
|
|
Russell 2000 Index
|
14.58
|
|
Russell 3000 Index
|
14.04
|
|
Russell 1000 Index
|
14.00
|
|
Russell 1000 Value Index
|
11.93
|
|
Russell 2000 Value Index
|
11.93
|
|
As of 3/31/2019
|
|
|
Period Returns (%)
|
QTD
|
1 Yr
|
3 Yrs*
|
5 Yrs*
|
10 Yrs*
|
|
Russell 1000 Growth Index
|
16.10
|
12.75
|
16.53
|
13.50
|
17.52
|
|
Russell 1000 Index
|
14.00
|
9.30
|
13.52
|
10.63
|
16.05
|
|
Russell 1000 Value Index
|
11.93
|
5.67
|
10.45
|
7.72
|
14.52
|
|
Russell 2000 Growth Index
|
17.14
|
3.85
|
14.87
|
8.41
|
16.52
|
|
Russell 2000 Index
|
14.58
|
2.05
|
12.92
|
7.05
|
15.36
|
|
Russell 2000 Value Index
|
11.93
|
0.17
|
10.86
|
5.59
|
14.12
|
|
Russell 3000 Index
|
14.04
|
8.77
|
13.48
|
10.36
|
16.00
|
|
As of 3/31/2019
|
|
* Annualized
|
International Developed Stocks
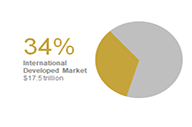 In US dollar terms, developed markets outside the US outperformed emerging markets but underperformed the US equity market during the quarter. Small caps outperformed large caps in non-US developed markets. Value underperformed growth across large and small cap stocks.
|
Ranked Returns for the Quarter
|
%
|
|
MSCI World ex USA Growth Index (net div.)
|
12.41
|
|
MSCI World ex USA Small Cap Index (net div.)
|
10.93
|
|
MSCI World ex USA Index (net div.)
|
10.45
|
|
MSCI World ex USA Value Index (net div.)
|
8.49
|
|
As of 3/31/2019
|
|
|
Period Returns (%)
|
QTD
|
1 Yr
|
3 Yrs*
|
5 Yrs*
|
10 Yrs*
|
|
MSCI World ex USA Growth Index (net div.)
|
12.41
|
-0.82
|
7.42
|
3.67
|
9.35
|
|
MSCI World ex USA Index (net div.)
|
10.45
|
-3.14
|
7.29
|
2.20
|
8.82
|
|
MSCI World ex USA Value Index (net div.)
|
8.49
|
-5.46
|
7.13
|
0.68
|
8.25
|
|
MSCI World ex USA Small Cap Index (net div.)
|
10.93
|
-8.66
|
7.28
|
3.69
|
12.25
|
|
As of 3/31/2019
|
|
* Annualized
|
Emerging Markets Stocks
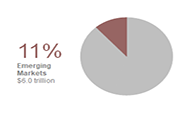 In US dollar terms, emerging markets underperformed developed markets, including the US. Value outperformed growth across small cap stocks but underperformed in large caps. Small caps underperformed large caps.
|
Ranked Returns for the Quarter
|
%
|
|
MSCI Emerging Markets Growth Index (net div.)
|
12.04
|
|
MSCI Emerging Markets Index (net div.)
|
9.92
|
|
MSCI Emerging Markets Value Index (net div.)
|
7.83
|
|
MSCI Emerging Markets Small Cap Index (net div.)
|
7.76
|
|
As of 3/31/2019
|
|
|
Period Returns (%)
|
QTD
|
1 Yr
|
3 Yrs*
|
5 Yrs*
|
10 Yrs*
|
|
MSCI Emerging Markets Value Index (net div.)
|
7.83
|
-5.27
|
9.54
|
2.21
|
7.83
|
|
MSCI Emerging Markets Index (net div.)
|
9.92
|
-7.41
|
10.68
|
3.68
|
8.94
|
|
MSCI Emerging Markets Growth Index (net div.)
|
12.04
|
-9.52
|
11.75
|
5.04
|
9.98
|
|
MSCI Emerging Markets Small Cap Index (net div.)
|
7.76
|
-12.42
|
5.95
|
1.76
|
10.37
|
|
As of 3/31/2019
|
|
* Annualized
|
Real Estate Investment Trusts (REITs)
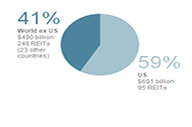 US real estate investment trusts outperformed non-US REITs in US dollar terms.
|
Ranked Returns for the Quarter
|
%
|
|
Dow Jones US Select REIT Index
|
15.72
|
|
S&P Global ex US REIT Index (net div.)
|
11.73
|
|
As of 3/31/2019
|
|
|
Asset Class
|
QTR
|
1 Yr
|
3 Yrs*
|
5 Yrs*
|
10 Yrs*
|
|
Dow Jones US Select REIT Index
|
15.72
|
19.73
|
5.29
|
8.93
|
18.50
|
|
S&P Global ex US REIT Index (net div.)
|
11.73
|
4.75
|
4.34
|
5.03
|
12.18
|
|
As of 3/31/2019
|
|
* Annualized
|
Commodities
The Bloomberg Commodity Index Total Return returned 6.32% for the first quarter of 2019. The energy complex led quarterly performance. Crude oil gained 29.40%, and unleaded gas added 25.92%. Grains was the worst-performing complex. Wheat (Kansas) and wheat (Chicago) declined by 13.14% and 9.52%, respectively.
|
Period Returns (%)
|
QTD
|
1 Yr
|
3 Yrs*
|
5 Yrs*
|
10 Yrs*
|
|
Bloomberg Commodity Index Total Return
|
6.32
|
-5.25
|
2.22
|
-8.92
|
-2.56
|
|
As of 3/31/2019
|
|
* Annualized
|
Fixed Income
Interest rates decreased in the US Treasury fixed income market during the first quarter. The yield on the 5-year Treasury note declined 28 basis points (bps), ending at 2.23%. The yield on the 10-year Treasury note decreased 28 bps to 2.41%. The 30-year Treasury bond yield fell 21 bps to finish at 2.81%. On the short end of the curve, the 1-month T-bill bill yield was relatively unchanged at 2.43%, while the 1-year T-bill yield dipped 23 bps to 2.40%. The 2-year Treasury note finished at 2.27% after a 21bps decrease. In terms of total returns, short-term corporate bonds gained 1.83%. Intermediate-term corporate bonds had a total return of 3.82%. Total returns for short-term municipal bonds were 1.33%, while intermediate munis gained 2.78%. Revenue bonds outperformed general obligation bonds. 1
|
Bond Yields Across Issuers
|
(%)
|
|
10-Year US Treasury
|
2.41
|
|
State and Local Municipals
|
3.06
|
|
AAA-AA Corporates
|
3.10
|
|
A-BBB Corporates
|
3.78
|
|
As of 3/31/2019
|
|
|
Period Returns (%)
|
QTR
|
1 Yr
|
3 Yrs*
|
5 Yrs*
|
10 Yrs*
|
|
Bloomberg Barclays Municipal Bond Index
|
2.90
|
5.38
|
2.71
|
3.73
|
4.72
|
|
Bloomberg Barclays US Aggregate Bond Index
|
2.94
|
4.48
|
2.03
|
2.74
|
3.77
|
|
Bloomberg Barclays US Government Bond Index Long
|
4.64
|
6.20
|
1.54
|
5.43
|
5.19
|
|
Bloomberg Barclays US High Yield Corporate Bond Index
|
7.26
|
5.93
|
8.56
|
4.68
|
11.26
|
|
Bloomberg Barclays US TIPS Index
|
3.19
|
2.70
|
1.70
|
1.94
|
3.41
|
|
FTSE World Government Bond Index 1-5 Years
|
0.34
|
-2.04
|
0.40
|
-0.95
|
0.71
|
|
FTSE World Government Bond Index 1-5 Years (hedged to USD)
|
1.16
|
3.13
|
1.59
|
1.65
|
1.73
|
|
ICE BofAML 1-Year US Treasury Note Index
|
0.82
|
2.44
|
1.21
|
0.85
|
0.7
|
|
ICE BofAML US 3-Month Treasury Bill Index
|
0.60
|
2.12
|
1.19
|
0.74
|
0.43
|
|
As of 3/31/2019
|
|
* Annualized
|
Global Fixed Income
Interest rates in the global developed markets generally decreased during the quarter. Longer-term bonds generally outperformed shorter-term bonds. Nominal rates in Germany and Japan are negative out to approximately 10 years.
|
Changes in Yields (bps) since 9/30/2018
|
1Y
|
5Y
|
10Y
|
20Y
|
30Y
|
|
US
|
-20.70
|
-26.50
|
-29.10
|
-24.50
|
-20.40
|
|
UK
|
-10.20
|
-19.50
|
-26.40
|
-26.40
|
-27.00
|
|
Germany
|
17.90
|
-17.90
|
-33.60
|
-31.00
|
-29.00
|
|
Japan
|
-3.40
|
-5.60
|
-9.50
|
-16.80
|
-21.50
|
|
As of 3/31/2019
|
|
|
|
|
|
Impact of Diversification
These portfolios illustrate the performance of different global stock/bond mixes and highlight the benefits of diversification. Mixes with larger allocations to stocks are considered riskier but have higher expected returns over time. 2
|
Ranked Returns for the Quarter
|
%
|
|
100% Stocks
|
12.33
|
|
75/25
|
9.33
|
|
50/50
|
6.37
|
|
25/75
|
3.46
|
|
100% Treasury Bills
|
0.58
|
|
As of 3/31/2019
|
|
|
Period Returns (%)
|
QTD
|
1 Yr
|
3 Yrs*
|
5 Yrs*
|
10 Yrs*
|
10-Yr STDEV¹
|
|
100% Stocks
|
12.33
|
3.16
|
11.27
|
7.03
|
12.58
|
13.92
|
|
75/25
|
9.33
|
3.07
|
8.75
|
5.53
|
9.6
|
10.44
|
|
50/50
|
6.37
|
2.85
|
6.21
|
3.97
|
6.57
|
6.95
|
|
25/75
|
3.46
|
2.51
|
3.67
|
2.35
|
3.49
|
3.48
|
|
100% Treasury Bills
|
0.58
|
2.05
|
1.11
|
0.68
|
0.37
|
0.18
|
|
As of 3/31/2019
|
|
* Annualized
|
Feature Article (Source material courtesy of DFA)
On Passive Investing and Market Mayhem
Back in 2016, the investment manager Sanford Bernstein warned that the trend toward passive investing undermines capitalism and “is worse than Marxism.” In 2017, a Morgan Stanley piece asserted that “The exodus from active to passive funds may be reaching bubble-like proportions, driven by an exaggerated critique of active management.” Hyperbole aside, Sanford Bernstein and Morgan Stanley are right to be concerned about passive investing. The trend is eating their lunch.
Passive investing is a buy-and-hold strategy that typically constructs portfolios from low-cost index funds, ETFs and other passively managed investments. Many investors fled to passively managed index funds following the economic meltdown of 2008, spurred by a desire for lower costs and better performance. The growth of ETF funds tells the story. In 2008, US investors held $531 billion in ETFs in their portfolios; by September 2018, that number had exploded to $3.4 trillion (Source: Statistica). The flow of money into Vanguard index funds is even more astounding: In a three-year period ending in 2017, Vanguard took in $823 billion, or “about 8.5 times as much money as all of its competitors combined,” reported the New York Times in April 2017.
Should this massive flow of money into index funds be cause for concern? Yes, say some members of the financial media. Here’s why: Indexing is “blind money” being thrown into the market, and the fire-hose inflows of recent years have reduced the effectiveness of price discovery, that is, the ability to discern what stocks are really worth. That can hurt investors and markets alike. And so it’s reasonable to ask, are market prices reliable despite big inflows into index funds? For answers, we looked to data from Dimensional Funds.
Many Buyer and Sellers
The booming popularity of index funds obscures the fact that index fund investors still make up a relatively small percentage of overall investors. For example, data from the Investment Company Institute 3 shows that as of December 2017, 35% of total net assets in US mutual funds and ETFs were held by index funds, compared to 15% in December of 2007. The majority of total fund assets (65%) were still managed by active mutual funds in 2017. As a percentage of total market value, index-based mutual funds and ETFs also remain relatively small. As shown in Exhibit 1, domestic index mutual funds and ETFs comprised only 13% of total US stock market capitalization in 2017.
Within this 13% of the investing world, many investors use nominally passive vehicles, such as ETFs, to engage in traditionally active trading. For example, while both a value index ETF and growth index ETF may be classified as index investments, investors may actively trade between these funds based on short-term expectations, needs, circumstances, or for other reasons. In fact, several index ETFs regularly rank among the most actively traded securities in the market.
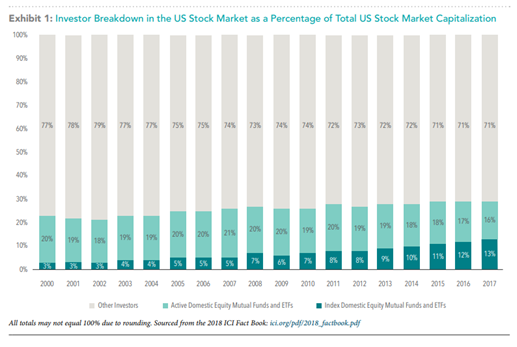
Beyond mutual funds, there are many other participants in financial markets, including individual security buyers and sellers, such as actively managed pension funds, hedge funds, and insurance companies, just to name a few. The takeaway: security prices reflect the viewpoints of all these investors.
Professors Eugene Fama and Kenneth French have pointed out that the impact of an increase in indexed assets depends to some extent on which market participants switch to indexing (“Q&A: What if Everybody Indexed?” blog post). “If misinformed and uninformed active investors (who make prices less efficient) turn passive, the efficiency of prices improves. If some informed active investors turn passive, prices tend to become less efficient. But the effect can be small if there is sufficient competition among remaining informed active investors. The answer also depends to some extent on the costs of uncovering and evaluating relevant knowable information. If the costs are low, then not much active investing is needed to get efficient prices.” 4 In other words, the efficiency of market pricing is affected by factors including investor knowledge, competition, and access to relevant information.
What’s the Volume?
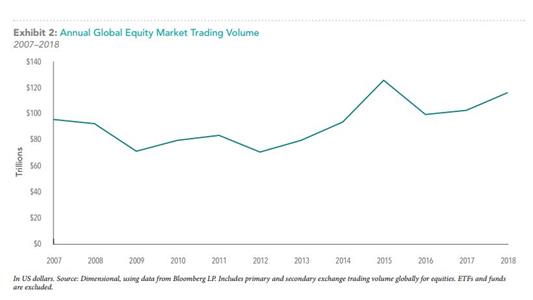
Trade volume data is another place to search for evidence of well-functioning markets. Exhibit 2 shows that despite the increased prevalence of index funds, annual equity market trading volumes have remained at similar levels over the past decade. And in a separate study (A drop in the bucket: Indexing's share of U.S. trading activity) Vanguard found that indexing strategies account for only minimal amounts of that activity. This indicates that price discovery continues to occur at a large scale across markets.
New information also gets incorporated into market prices through other means. For example, companies can impact prices by issuing stock and repurchasing shares. From DFA: “In 2018 alone, there were 1,633 initial public offerings, 3,492 seasoned equity offerings, and 4,148 buybacks around the world.5 The derivatives markets also help incorporate new information into market prices as the prices of those financial instruments are linked to the prices of underlying equities and bonds. On an average day in 2018, market participants traded over 1.5 million options contracts and $225 billion worth of equity futures.” 6
Hypothesis in Practice
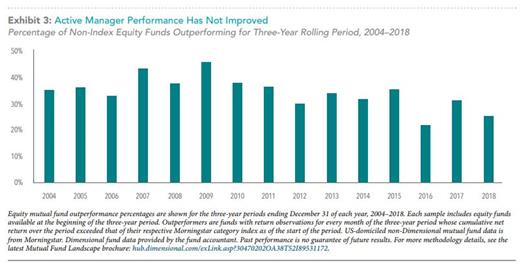
So far, the historical empirical evidence suggests that the rise of indexing is unlikely to distort market prices. But let’s consider the counterargument: that the rise of indexing does distort markets and in turn causes prices to become less reliable. If this were the case, one would expect stock picking managers attempting to capture mispricing to have an increasing rate of success over time.
Exhibit 3 shows the percentage of active managers that survived and beat their benchmarks over rolling three-year periods. There is no strong evidence of a link between the percentage of equity mutual fund assets in index funds and the percentage of active funds outperforming benchmark indices.
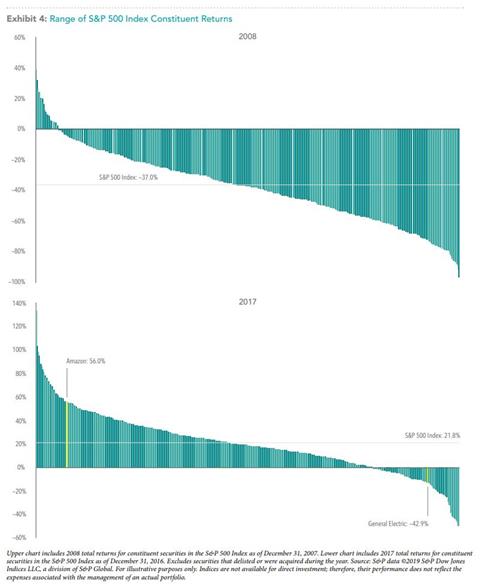
Finally, if index funds had a bias on prices, we would expect to see that evidence across an index fund’s holdings. In other words, there should be more uniformity in the returns for securities within the same index as inflows drive prices up uniformly and outflows drive prices down. Using the S&P 500 Index as an example, this has not been the case. In 2008, a year of large net outflows and an index return of –37%, the returns of stocks within the index ranged from 39% to negative –97%. And in 2017, a year of large net inflows and a positive index return of 21.8%, the returns of stocks within the index ranged from 133.7% to negative –50.3%. We would also expect that constituents with similar weighting in traditional market cap-weighted indices would have similar returns. In 2017, Amazon and General Electric returned 56.0% and negative –42.9%, respectively, despite each accounting for approximately 1.5% of the S&P 500 Index.
The Markets are Working
In sum, data supports the idea that markets are working even as the popularity of index funds continues to grow. Annual trading volume continues to be in line with prior years, indicating that price discovery continues to be driven by market participant transactions. The majority of active mutual fund managers continue to underperform their benchmarks, suggesting that the rise of indexing has not made it easier to outguess market prices. Prices and returns of individual holdings within indices are not moving in lockstep with asset flows into index funds.
On top of that, indexers still represent a small percentage of the diverse array of investor types. Markets are still functioning as usual, and willing buyers and sellers continue to agree on buy/sell prices that they consider to be fair transactions. Indexing may stir the ire of Wall Street, but it is only one solution in a universe of investment options. The more valid concern may be that investors, once so easily fooled by hype and promises, are viewing their options in a whole new light.
Do you have questions or concerns? Call us. We are here to help.
Regards,
John Gorlow
President
Cardiff Park Advisors
888.332.2238 Toll Free
760.635.7526 Direct
760.271.6311 Cell
760.284.5550 Fax
jgorlow@cardiffpark.com
1. One basis point equals 0.01%. Past performance is not a guarantee of future results. Indices are not available for direct investment. Index performance does not reflect the expenses associated with the management of an actual portfolio. Yield curve data from Federal Reserve. State and local bonds are from the S&P National AMT-Free Municipal Bond Index. AAA-AA Corporates represent the ICE BofAML US Corporates, AA-AAA rated. A-BBB Corporates represent the ICE BofAML US Corporates, BBB-A rated. Bloomberg Barclays data provided by Bloomberg. US long-term bonds, bills, inflation, and fixed income factor data © Stocks, Bonds, Bills, and Inflation (SBBI) Yearbook™, Ibbotson Associates, Chicago (annually updated work by Roger G. Ibbotson and Rex A. Sinquefield). FTSE fixed income indices © 2019 FTSE Fixed Income LLC, all rights reserved. ICE BofAML index data © 2019 ICE Data Indices, LLC. S&P data © 2019 S&P Dow Jones Indices LLC, a division of S&P Global. All rights reserved.
2. STDEV (standard deviation) is a measure of the variation or dispersion of a set of data points. Standard deviations are often used to quantify the historical return volatility of a security or portfolio. Diversification does not eliminate the risk of market loss. Past performance is not a guarantee of future results. Indices are not available for direct investment. Index performance does not reflect expenses associated with the management of an actual portfolio. Asset allocations and the hypothetical index portfolio returns are for illustrative purposes only and do not represent actual performance. Global Stocks represented by MSCI All Country World Index (gross div.) and Treasury Bills represented by US One-Month Treasury Bills. Globally diversified allocations rebalanced monthly, no withdrawals. Data © MSCI 2019, all rights reserved. Treasury bills © Stocks, Bonds, Bills, and Inflation Yearbook™, Ibbotson Associates, Chicago (annually updated work by Roger G. Ibbotson and Rex A. Sinquefield).
3. ici.org/pdf/2018_factbook.pdf
4. famafrench.dimensional.com/questions-answers/qa-what-if-everybody-indexed.aspx
5. Options, futures, and corporate action data are from Bloomberg LP. Options contact volume is the sum of the 2018 daily average put and call volume of options on the S&P 500 Index, Russell 2000 Index, MSCI EAFE Index, and MSCI Emerging Markets Index. Equity futures volume is equal to total 2018 futures volume traded divided by 252, where annual volume traded is estimated as the sum of monthly volume times month end contract value for S&P 500 Mini futures, Russell 2000 Mini futures, MSCI EAFE Mini futures, and MSCI Emerging Markets Mini futures. IPO, seasoned equity offering, and share repurchase data are based on Bloomberg corporate actions data and include countries that are eligible for Dimensional investment.
6. Source: S&P Dow Jones