John Gorlow
| Jul 12, 2022

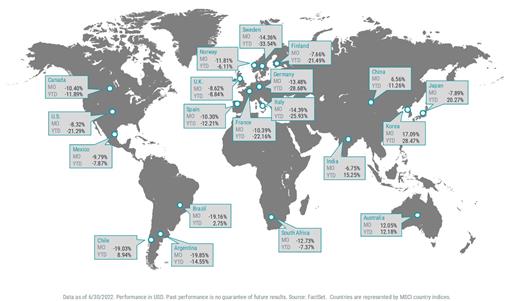
Markets tumbled and then ended June 2022 with a second consecutive quarterly loss. There was negative news on every front: surging inflation, hawkish central banks, rising interest rates, record-low U.S. consumer confidence and slowing economic growth. Little wonder that performance was slammed across the board. Most stock indices logged double-digit Q2 declines, while bond losses varied depending on sector and maturity.
After declining nearly 5% in the first quarter, the S&P 500 Index slipped into bear market territory and fell more than 16% in the second quarter. With a year-to-date total return of -20%, the index suffered its worst first-half performance since 1970.
All sectors of the S&P 500 Index declined in June and for the second quarter. The consumer staples sector fared the best for the quarter, dropping almost 5%, while consumer discretionary stocks were the worst, plunging more than 26%.
U.S. inflation ended the quarter at 8.6% (year over year), a 41-year-high. European inflation rose to a record 8.6%, while U.K. inflation hit a 40-year high of 9.1%.
Soaring inflation prompted the Fed to raise rates 50 bps in May and 75 bps in June, the first 75-bps hike in 28 years. The Bank of England lifted rates for the fifth time since December. The European Central Bank said its asset-purchase program would end in July, setting the stage for its first rate hike in 11 years.
U.S. stocks (S&P 500) fared better than their developed markets peers in June. However, U.S. stocks underperformed for the second quarter. Emerging markets stocks outperformed developed markets stocks in June and for the quarter.
U.S. Treasury yields rose in June and for the quarter overall, leading to widespread losses for bonds.
U.S. Equity Returns
All major size and style categories posted steep losses for the second quarter and year-to-date period.
Large-cap stocks fared modestly better than small-cap stocks in the quarter. Year to date, the broad large- and small-cap indices were down more than 20%.
Style performance across capitalizations favored value stocks over growth stocks for the quarter and year to date. Nevertheless, growth and value stocks suffered sharp losses for both periods.
Non-U.S. Developed Markets Equity Returns
International developed markets stocks declined for the second quarter and the year-to-date period.
Similar to performance among U.S. stocks, large caps outperformed small caps in the second quarter and for the six-month period.
Value stocks generally fared better than growth stocks in the second quarter and year to date. For the year-to-date period, large-cap value stocks declined nearly 10%, while small-cap growth stocks plunged almost 30%.
Emerging Market Equity Returns
The broad emerging markets stock index declined but outperformed developed markets indices for the quarter and the year-to-date period.
Tracking performance trends in developed markets, large-cap stocks outperformed small-cap stocks for the second quarter and year to date.
Large- and small-cap value stocks declined but outperformed their growth stock peers for both time periods. Small-cap growth stocks delivered the worst relative performance in the second quarter and year to date.

Fixed Income Returns
Persistently high inflation and aggressive tightening from the Fed drove U.S. Treasury yields higher. U.S. bonds posted negative returns for June and the second quarter, led by corporate bonds.
The Bloomberg U.S. Aggregate Bond Index declined 1.6% in June, leading to a loss of 4.7% for the second quarter. Corporate bonds, mortgage-backed securities and Treasuries retreated for the month and quarter.
The yield on the 10-year U.S. Treasury note soared to 3.5% by mid-June before retreating by month-end due to weaker economic data. Overall, the 10-year yield rose from 2.35% on March 31 to 3.01% on June 30. The two-year Treasury yield rose 62 bps to 2.96%, and the yield curve steepened modestly.
Annual headline inflation jumped to 8.6% in May, the highest rate since December 1981. Rising energy costs, including record-high gasoline prices, were significant contributors to inflation’s surge.
After raising rates 50 bps in May, the Fed lifted rates 75 bps in June, the first-rate hike of 75 bps since 1994. At quarter-end, Fed futures contracts signaled an 81% chance of another 75 bps Fed rate hike in July.
Municipal bond (muni) yields also rose, and munis underperformed Treasuries in June. However, a rally in May helped munis outperform Treasuries for the second quarter.
Five- and 10-year inflation breakeven rates eased in the quarter as growth expectations softened. TIPS were among the worst-performing fixed-income sectors for the three-month period.
Weathering the Storm
Uncertainty is the nature of markets, and the one thing all investors must be willing to live with. When markets rise, it is uncertain how long the trend will last. And the same is true when markets fall. Reacting to volatility, rather than simply living with it, can harm or derail progress toward long-term financial goals.
Marlena Lee, Global Head of Investment Solutions at DFA, recently reminded investors of several good reasons to hold tight during market storms. Here we recap two of them.
A Recession is Not a Reason to Sell
The question of whether we are in a recession is top-of-mind for many investors. A century of economic cycles teaches us we may well be in a recession before economists make that call.
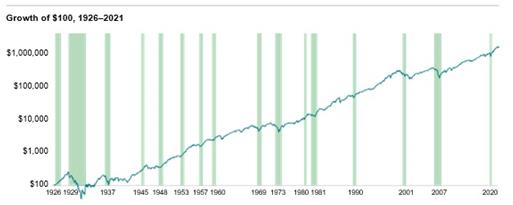
But one of the best predictors of the economy is the stock market itself. Markets tend to fall in advance of recessions and start climbing earlier than the economy does. As the chart below shows, returns have often been positive while in a recession. 1

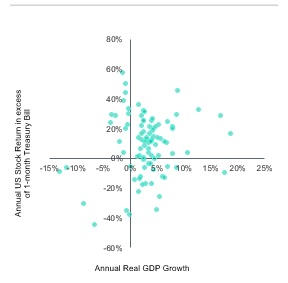
Now consider the next chart. All the dots in the upper left quadrant are years where the U.S. economy contracted but U.S. stocks still outperformed less-risky Treasury bills. It’s a great illustration of the forward-looking nature of markets. If you’re worried, other investors are too, and that uncertainty is reflected in stock prices. 2

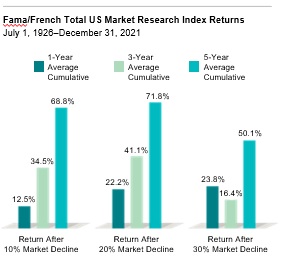
Whether accompanied by recessions or not, market downturns can be unsettling. But over the past century, U.S. stocks have averaged positive returns over one-year, three-year, and five-year periods following a steep decline. A year after the S&P 500 crossed into bear market territory (a 20% fall from the market’s previous peak), it rebounded by about 20% on average. And after five years, the S&P 500 averaged returns over 70%. 3

Staying invested puts you in the best position to capture the recovery. If you take risk out of your portfolio, it should be a strategic, not tactical, choice. We believe the only good reason to sell out of a stock portfolio now—so long as it’s diversified and low-cost—is because you learned something about your risk tolerance or your investment goals have changed.
Market Timing Can Hurt More Than Help
When stocks fall sharply, it may be tempting to sell to halt further losses. But while selling may help you feel better now, it might make you feel worse a week, a month, or a year from now. That’s because there is no sure way to know when to get back in. Markets can be volatile both on the way up and the way down. By the time things settle down, you’re likely to have missed part of the recovery.
Days in which stocks jump higher are difficult to predict, and you must be in the market when they happen—not the day after, or a week later when you think you spot a trend. If you invested $1,000 in the S&P 500 continuously from the beginning of 1990 through the end of 2020, you would have amassed $20,451. If you missed the single best day, you’d only have $18,329—and if you missed the best five days, only $12,917.
History shows the stock market tends to rebound quickly, though individual stocks or entire sectors can rebound more slowly or unevenly. That’s why a diversified portfolio is such a critical tool for mitigating risk. And if you want to outperform the market, decades of academic research have demonstrated that portfolios focused on small caps, value stocks, and more profitable companies have higher returns over the long run.
For weary investors hoping for a bottom in global equity markets, an imminent recession is unnerving. But not all is bleak. A recession would bring about relief from inflationary pressures by restoring greater balance between demand and supply in the economy. In turn, it would lessen the need for aggressive central bank tightening, thereby making the downturn shorter and shallower than would otherwise be the case. Cost shocks that we are experiencing right now will pass. Remaining invested, diversified and sticking with your plan may cause discomfort today, but is the most reliable way to achieve stronger future returns.
Do you have questions about your portfolio or asset allocation? Call me. I am here to help.
Regards
John Gorlow
President
Cardiff Park Advisors
888.332.2238 Toll Free
760.635.7526 Direct
760.271.6311 Cell
760.284.5550 Fax
jgorlow@cardiffpark.com
Foot Notes
Past performance is no guarantee of future results.
1. In US dollars. Recessions shaded in green. Stock returns represented by Fama/French Total US Market Research Index, provided by Ken French and available at mba.tuck.dartmouth.edu/pages/faculty/ken.french/data_library.html. This value-weighed US market index is constructed every month, using all issues listed on the NYSE, AMEX, or Nasdaq with available outstanding shares and valid prices for that month and the month before. Exclusions: American depositary receipts.
Sources: CRSP for value-weighted US market return. Rebalancing: Monthly. Dividends: Reinvested in the paying company until the portfolio is rebalanced. Growth of wealth shows the growth of a hypothetical investment of $100 in the securities in the Fama/French US Total Market Research Index from July 1926 through December 2021.
2. Indices are not available for direct investment. Their performance does not reflect the expenses associated with the management of an actual portfolio. In USD. Annual GDP growth rates obtained from the US Bureau of Economic Analysis. GDP growth numbers are adjusted to 2012 USD terms to remove the effects of inflation. Data provided by Fama/French. Eugene Fama and Ken French are members of the Board of Directors of the general partner of and provide consulting services to, Dimensional Fund Advisors LP. Please see “Appendix Descriptions” for a description of the Fama/French index data.
Results shown during periods prior to each index’s index inception date do not represent actual returns of the respective index. Other periods selected may have different results, including losses. Backtested index performance is hypothetical and is provided for informational purposes only to indicate historical performance had the index been calculated over the relevant time periods. Backtested performance results assume the reinvestment of dividends and capital gains.
3. Market declines or downturns are defined as periods in which the cumulative return from a peak is -10%, -20%, or -30% or lower. Returns are calculated for the 1-, 3-, and 5-year look-ahead periods beginning the day after the respective downturn thresholds of -10%, -20%, or -30% are exceeded. The bar chart shows the average returns for the 1-, 3-, and 5-year periods following the 10%, 20%, and 30% thresholds. For the 10% threshold, there are 29 observations for 1-year look-ahead, 28 observations for 3-year look-ahead, and 27 observations for 5-year look-ahead. For the 20% threshold, there are 15 observations for 1-year look-ahead, 14 observations for 3-year look-ahead, and 13 observations for 5-year look-ahead. For the 30% threshold, there are 7 observations for 1-year look-ahead, 6 observations for 3-year look-ahead, and 6 observations for 5-year look-ahead. Peak is a new all-time high prior to a downturn. Data provided by Fama/French and available at mba.tuck.dartmouth.edu/pages/faculty/ken.french/data_library.html. Fama/French Total US Market Research Index: 1926–present: Fama/French Total US Market Research Factor and One-Month US Treasury Bills. Source: Ken French website.