John Gorlow
| Jan 17, 2024

Perhaps the most predictable thing about 2023 was that most market predictions would be wrong. Many pundits foresaw a recession, a stalled economy, stubbornly high inflation, job layoffs and more. Instead, the U.S. economy proved to be remarkably resilient, rewarding investors with a stunning stock rally in the final two months of the year. Markets were lifted by a raft of good news, including inflation falling faster than expected, strong U.S. economic output, and a healthy labor market. Driving the year-end surge was the belief that central banks are done with interest rate hikes and will soon begin rate cuts. How that story unfolds remains to be seen.
Market data from 2023 tell a positive story:
- The MSCI World index, a gauge of global equities, surged 16 percent beginning in late October and was up 22 percent for the year.
- The S&P 500 closed out 2023 with a gain of more than 24%, and the Dow Jones Industrial Average finished near a record high.
- The Nasdaq returned more than 43%, its best performance since 2020.
- The Russell 2000 index finished 2023 with a 15.1% gain after falling 21.6% in 2022.
- What about bonds? Investors seemed to be heading for a third consecutive losing year, but then the mood shifted and they began to believe that rate cuts might happen. This sent bond prices soaring and yields falling. The yield on the 10-year Treasury, which hit 5% in October, fell more than a full percentage point to 3.88% by the end of the year. As a result, the long end of the U.S. government bond market posted a whopping fourth-quarter total return of 12.09%, leaving yields on many fixed-income securities below Wall Street targets. Bonds thus became less attractive to investors.
While 2023 turned out to be a blockbuster year for investors, very few saw it coming.
Why Market Predictions Don’t Serve Your Best Interests
Here we are again in January, and once again investors’ inboxes are flooded with advice and predictions, encouraging them to do something different to protect their portfolios from all the havoc in the world. There’s certainly plenty to be concerned about in 2024: wars in Ukraine and the Middle East, jitters in Taiwan, Houthi attacks in the Red Sea, and the existential threat of global warming.
There are also worrisome economic issues driven by the burgeoning U.S. fiscal deficit (and equally troubling government deficits in other developed nations). Some doubt that stocks can continue their upward trend as many companies thriving on post-Covid federal largesse are forced to refinance their debt. And the Fed itself has warned that its fight with inflation isn’t over. Despite the market’s recent high-flying performance, these are tricky times. A recession could be spurred by higher borrowing costs and rising bankruptcies, as well as a resurgence of inflation.
Despite these concerns, we don’t have to look back very far to understand that we have weathered equally if not more challenging events, including the Covid-19 pandemic, a global economic shutdown, supply chain snarls, soaring inflation and rapid interest rate hikes. Somehow we not only made it through these events, but rebounded quickly. And while it feels like the world was turned upside down by the pandemic and its aftermath, we are right on target with predictions made by the Congressional Budget Office back in January 2020. This is oddly fascinating, writes Greg Ip (Wall Street Journal, 20-December, “Meet the New Economy, Just Like the Old Economy”).
Ip notes: “Comparing the Congressional Budget Office’s economic predictions from January 2020, shortly before the pandemic, with the forecast it released last week, in the current quarter, the U.S. economy will be almost exactly the same size (measured by inflation-adjusted gross domestic product) it predicted four years ago. Growth averaged 1.8% over the past four years, exactly as predicted. The epic collapse of output in early 2020 and gyrations since canceled each other out.
How about unemployment? The CBO figures it should average 3.9% this quarter, a tad lower than the 4.2% projected four years ago.
Surely inflation is higher. But no: the CBO thinks the consumer-price index will be up 2.5% annualized in the current quarter, lining up nicely with the 2.4% penciled in four years ago.
At times, the pandemic seemed like it might permanently alter the path of growth. There were fears social distancing and virus variants would corrode productivity and drive millions out of the labor force for good, stunting long-run growth. That didn’t happen, either.”
By now you may be asking, what does the CBO predict next? Ip reports that “the CBO and Federal Reserve now put long-run U.S. growth around 1.8%, close to what they saw four years ago.”
Of course, despite the CBO’s accurate predictions, we are in a very different place than we were four years ago. An erosion of democracy and rise of authoritarianism, a surge in misinformation, the rise of nationalism and challenges to free markets all can be seen as serious threats to the stability and economic health of the U.S. and other nations. But on the upside, “the digitization of work, commerce and medical care, breakthroughs in renewable energy, and the transformative potential of artificial intelligence offer the potential to boost productivity and global economic growth,” writes Gillian Tett (Financial Times, 12-January, “Reasons to be Optimistic”).
You can worry or be optimistic; you can believe the worst or best predictions. It doesn’t really matter. The fact is that we never arrive at the future via a straight line, but through a maze of events that are mostly unforeseen. Perhaps you haven’t even thought about the unforeseen consequences of elections on the bond market. This year, “More than 2 billion people across 50 countries will go to the polls. Pre-election borrowing promises could trigger a bond market backlash,” writes the Financial Times (12-January, “The 2024 Financial Market Rollercoaster”). And many analysts now agree that even if inflation declines, it will probably remain higher for the next decade than in the decade following the financial crisis. Predictions abound about the impacts on business growth and government investment.
Trying to predict the future is maddening. This is why it’s so important to step out of the weeds to see the big picture. Jeff Sommer sums it up nicely (New York Times, 23-December 2023): “Over many decades, the entire global stock market has trended upward, and as long as capitalism survives, and companies continue to profit, the stock market as a whole is likely to climb. But it certainly won’t do so all the time. If you’ve been in the market at all, you know that it rises and falls. These movements are, for the most part, unpredictable.” He goes on to note the obvious: the world is enormously complex and major shifts will surely arise from events that no one can imagine.
We have written many times about the perils of trying to time the market. And timing the market is really the “ask” that underlies all predictions. There is a simpler way. Keep enough money liquid to pay the bills and fund your needs. Diversify the rest in low-cost funds, taking risks commensurate with your goals and timeline. Invest for the long term. Ignore forecasts. Where your money is concerned, try not to act out of fear.
Sommer offers this advice: “Hope for the best, prepare for the worst and get on with life. Unfortunately, Wall Street forecasts won’t help with any of that.”
Now let’s take a look at Q4 market performance.
Quarterly Market Snapshot
Courtesy of Avantis and Dimensional Fund Advisors
U.S. and global stocks and bonds rallied to close out 2023. Plunging bond yields, slowing inflation and more-dovish central bank policy coincided with the late-year surge.
Solid gains in November and December boosted the S&P 500 Index’s 2023 returns to more than 26%. Falling Treasury yields, easing inflation and expectations for the Fed to start cutting interest rates in 2024 contributed to an upbeat market backdrop.
The interest-rate-sensitive real estate sector was the top-performing S&P 500 sector for the month and quarter. For both periods, the energy sector was the sole decliner. Year to date, the technology sector’s return topped 57%.
Non-U.S. developed market stocks rallied but lagged U.S. stocks for the quarter and year. Emerging market stocks advanced but not as strongly as their developed markets peers.
All U.S. size and style indices rallied for the month and quarter. Small-cap stocks outperformed large caps, while growth outperformed value among large-caps and underperformed among small-caps. Outside the U.S., small caps outperformed large caps in December, and both categories performed similarly for the quarter. Growth outperformed value in both periods.
In its attempt to engineer a soft landing, the Fed held rates steady and eyed three rate cuts in 2024. The European Central Bank and Bank of England also remained on hold for the quarter.
After climbing to 3.7% in August, the annual rate of U.S. headline inflation slowed to 3.1% by November. Inflation moderated to 2.4% in Europe and 3.9% in the U.K.
U.S. Treasury yields declined for the month and quarter, and the broad bond market delivered solid gains.
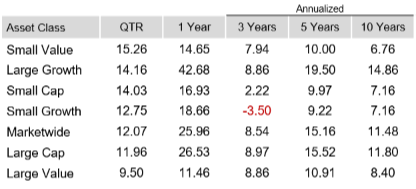
U.S. Stocks (61% of Global Market Cap)
The U.S. equity market posted positive returns for the quarter and outperformed both non-U.S. developed and emerging markets.
Value underperformed growth within large caps and outperformed within small caps.
Small caps outperformed large caps.
REIT indices outperformed equity market indices.
Fourth Quarter Ranked Returns (%)

Period U.S. Returns (%) 1
International Developed Stocks (28% of Global Market Cap)
Developed markets outside of the U.S. posted positive returns for the quarter and underperformed the U.S. market, but outperformed emerging markets.
Value underperformed growth.
Small caps outperformed large caps
Fourth Quarter Ranked Returns (%)
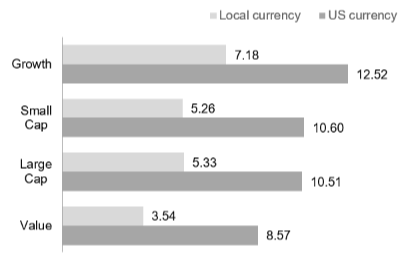
Period Returns (%) 2

Emerging Market Stocks (11% of Global Market Cap)
Emerging markets posted positive returns for the quarter and underperformed both US and non-US developed markets.
Value outperformed growth.
Small caps outperformed large caps
Fourth Quarter Returns (%)
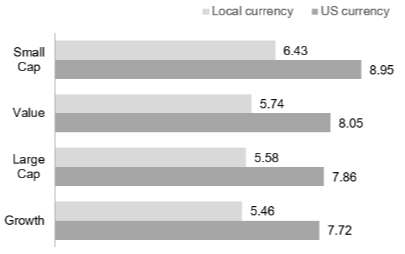
Period Returns % 3

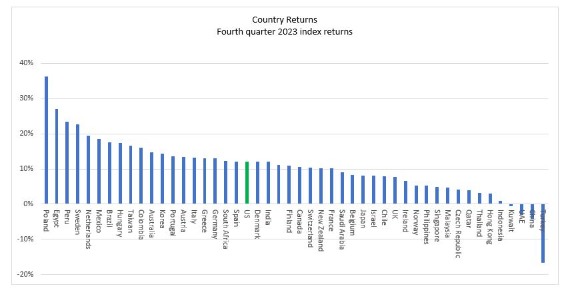
Country Returns
Fourth Quarter Ranked Returns 4
Real Estate Investment Trusts (REITs)
U.S. real estate investment trusts outperformed non-U.S. REITs during the quarter.
Fourth Quarter Ranked Returns (%)

Period Returns %) 5

Commodities
The Bloomberg Commodity Total Return Index returned -4.63% for the fourth quarter of 2023.
Natural Gas and Sugar were the worst performers, returning -25.63% and -22.28% during the quarter, respectively. Coffee and Wheat were the best performers, returning +31.46% and +11.26% during the quarter, respectively.
Period Returns 6

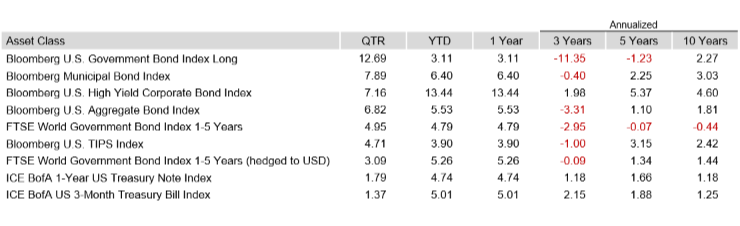
Fixed Income
U.S. bonds rebounded sharply in the fourth quarter amid declining Treasury yields and cooling inflation. The fourth-quarter rally left the broad bond market index with a solid year-to-date gain.
The Bloomberg U.S. Aggregate Bond Index returned 3.83% in December and 6.82% for the fourth quarter. This late-year rebound, amid slowing inflation and a more-dovish Fed, pushed the index’s one-year return to 5.53%.
Treasury yields sharply declined in the quarter, with the 10-year note ending December at 3.88%, 70 bps lower than September 30. The two-year Treasury yield dropped 80 bps to 4.25%
After widening early in the quarter, credit spreads tightened through December, and corporate bonds outperformed Treasuries in December and the fourth quarter. MBS also outperformed Treasuries. High-yield corporates advanced but lagged investment-grade corporates for both periods.
The Fed held rates steady throughout the quarter. By December, policymakers noted they expect to make three rate cuts in 2024.
Annual headline CPI slowed in the quarter to 3.1% in November, largely due to falling energy prices. Core inflation moderated to a 4% annualized gain in November. The shelter index, up 6.5%, continued to account for approximately 70% of the increase in core CPI.
Bond Yields Across Issuers (%)

Period Returns (%) 7, 8, 9
As always, if you have questions about your portfolio or allocations, please contact us. We are here to help.
Regards,
John Gorlow
President
Cardiff Park Advisors
888.332.2238 Toll Free
760.635.7526 Direct
760.271.6311 Cell
Footnotes
Past performance is not a guarantee of future results. Indices are not available for direct investment. Index performance does not reflect the expenses associated with the management of an actual portfolio.
1) Market segment (index representation) as follows: Marketwide (Russell 3000 Index), Large Cap (Russell 1000 Index), Large Value (Russell 1000 Value Index), Large Growth (Russell 1000 Growth Index), Small Cap (Russell 2000 Index), Small Value (Russell 2000 Value Index), and Small Growth (Russell 2000 Growth Index). World Market Cap represented by Russell 3000 Index, MSCI World ex USA IMI Index, and MSCI Emerging Markets IMI Index. Russell 3000 Index is used as the proxy for the US market. Dow Jones US Select REIT Index used as proxy for the US REIT market. MSCI data © MSCI 2024, all rights reserved. Frank Russell Company is the source and owner of the trademarks, service marks, and copyrights related to the Russell Indexes.
2) Market segment (index representation) as follows: Large Cap (MSCI World ex USA Index), Small Cap (MSCI World ex USA Small Cap Index), Value (MSCI World ex USA Value Index), and Growth (MSCI World ex USA Growth Index). All index returns are net of withholding tax on dividends. World Market Cap represented by Russell 3000 Index, MSCI World ex USA IMI Index, and MSCI Emerging Markets IMI Index. MSCI World ex USA IMI Index is used as the proxy for the International Developed market. MSCI data © MSCI 2024, all rights reserved. Frank Russell Company is the source and owner of the trademarks, service marks, and copyrights related to the Russell Indexes.
3) Market segment (index representation) as follows: Large Cap (MSCI Emerging Markets Index), Small Cap (MSCI Emerging Markets Small Cap Index), Value (MSCI Emerging Markets Value Index), and Growth (MSCI Emerging Markets Growth Index). All index returns are net of withholding tax on dividends. World Market Cap represented by Russell 3000 Index, MSCI World ex USA IMI Index, and MSCI Emerging Markets IMI Index. MSCI Emerging Markets IMI Index used as the proxy for the emerging market portion of the market. MSCI data © MSCI 2024, all rights reserved. Frank Russell Company is the source and owner of the trademarks, service marks, and copyrights related to the Russell Indexes.
4) Country returns are the country component indices of the MSCI All Country World IMI Index for all countries except the United States, where the Russell 3000 Index is used instead. Global is the return of the MSCI All Country World IMI Index. MSCI index returns are net dividend. Indices are not available for direct investment. Their performance does not reflect the expenses associated with the management of an actual portfolio. MSCI data © MSCI 2024, all rights reserved. Frank Russell Company is the source and owner of the trademarks, service marks and copyrights related to the Russell Indexes.
5) Number of REIT stocks and total value based on the two indices. All index returns are net of withholding tax on dividends. Total value of REIT stocks represented by Dow Jones US Select REIT Index and the S&P Global ex US REIT Index. Dow Jones US Select REIT Index used as proxy for the US market, and S&P Global ex US REIT Index used as proxy for the World ex US market. Dow Jones and S&P data © 2024 S&P Dow Jones Indices LLC, a division of S&P Global. All rights reserved.
6) Commodities returns represent the return of the Bloomberg Commodity Total Return Index. Individual commodities are sub-index values of the Bloomberg Commodity Total Return Index. Data provided by Bloomberg.
7) Bloomberg US Treasury and US Corporate Bond Indices.
8) Bloomberg Municipal Bond Index.
9) One basis point (bps) equals 0.01%. Past performance is not a guarantee of future results. Indices are not available for direct investment. Index performance does not reflect the expenses associated with the management of an actual portfolio. Yield curve data from Federal Reserve. State and local bonds, and the Yield to Worst are from the S&P National AMT-Free Municipal Bond Index. AAA-AA Corporates represent the ICE BofA US Corporates, AA-AAA rated. A-BBB Corporates represent the ICE BofA Corporates, BBB-A rated. Bloomberg data provided by Bloomberg. US long-term bonds, bills, inflation, and fixed income factor data © Stocks, Bonds, Bills, and Inflation (SBBI) Yearbook™, Ibbotson Associates, Chicago (annually updated work by Roger G. Ibbotson and Rex A. Sinquefield). FTSE fixed income indices © 2024 FTSE Fixed Income LLC, all rights reserved. ICE BofA index data © 2024 ICE Data Indices, LLC. S&P data © 2024 S&P Dow Jones Indices LLC, a division of S&P Global. All rights reserved. Bloomberg data provided by Bloomberg.