John Gorlow
| Mar 19, 2024

Shrugging off uncertainty over inflation and Fed policy, Wall Street celebrated its fourth consecutive winning month in February. The Nasdaq closed at a record high, and both the Dow and S&P 500 turned in the best two months at the beginning of a new year since the pre-Covid days of 2019. Perhaps all this good news makes you feel anxious about what comes next. Will markets continue their climb, or are they primed for a fall? As an alternative to predictions and Fed watching, I encourage you to consider verifiable historical data about market peaks, valleys and recovery times over the past 100 years.
The markets have endured a long history of stormy weather. On “Black Monday” in 1987, the S&P 500 plummeted more than 20%, the largest single-day decline since the market’s inception. The Great Recession of 2007 marked the longest period of financial decline since the 1930s. And on March 16, 2020, the S&P 500 shed more than 12% as Covid-19 shuttered the U.S. economy, then bottomed out with a 34% decline one week later. After that, volatility was the norm until markets settled into a deep slump for both stocks and bonds that lasted for most of 2022. That year, markets lost about 20%.
Consider where we are today, not even two years distant from the market lows of late 2022, and four years from the onset of Covid-19. You may be surprised to learn that the cumulative total return for the S&P 500 over the past four years is 58.29%, with 122 new all-time highs along the way. For that same four-year period, the annualized rate of return for the index stands at more than 12%.
Figure 1 below shows the volatile pathway of the past four years.
Figure 1 | S&P 500 Index Performance following the Pre-Covid peak on February 19, 2020
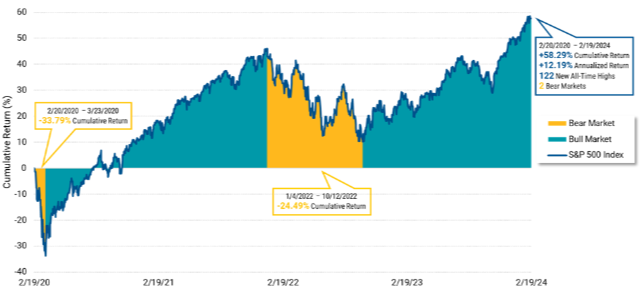
Figure 2 below shows U.S. market drawdowns and recovery periods from July 1925 through December 2023. Periods of market volatility are surprisingly common. Over those 97 years, there have been more than 30 declines of 10% of more. Averaged out, the market has declined 10% or more every three years, and 20% or more every six years. (Note that in “number of declines,” each bucket includes the more severe drops; for instance, those calculated at 20% or more are included in the total for 10% or more.) Of course, the market doesn’t operate like clockwork and is not predictable in the way an average might suggest.
Figure 2 | Market Declines Are Not Rare
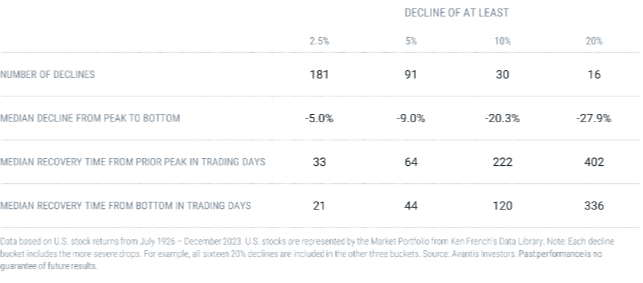
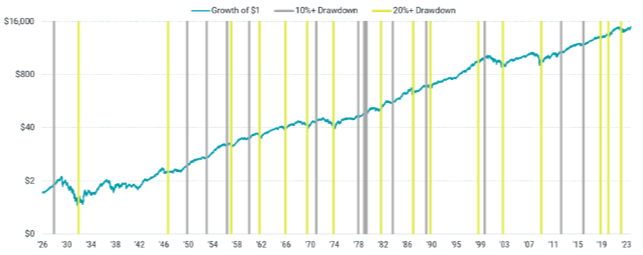
Figure 3 captures the beauty of long-term, buy-and-hold investing, and the wisdom of ignoring all those peaks and valleys. Here you see the growth of a U.S. dollar since 1926, plotted against individual corrections of greater than 10%, and bear market periods of greater than 20%. The buy-and-hold investor weathered many storms over those 97 years. But by tuning out the noise and staying the course, investors were rewarded with compounded returns of over 10%. True, there were long stretches of time when the index dramatically underperformed its long-term average. The worst 20-year return, ending in 1949, saw a gain of less than 2%. This makes sense when you consider that this era included the Great Depression and World War II.
What about returns during other challenging times? For the 20 years ending in March 2020, a period encompassing the Dot-com Bubble and the Great Financial Crisis, equity returns were less than 5% per annum, not much different than the long-term 4.84% return available from 5-year U.S. Treasury Notes. A dismal return, to be sure, but also a good reminder not to fixate on one single 20-year period. Instead, consider continuously rolling periods of 20 years since 1925. Now the data shows annual returns of 7% or higher, 90% of the time. This is the argument for maintaining a long-term position in equities.
Figure 3 | Despite Declines, Markets Continue to Reach New Highs
Growth of $1 Since 1926, Including Market Corrections and Bear Markets
Investing Without Emotion
Market downturns may be stressful, but markets on the upswing create their own kind of anxiety. Since October, the market is up over 20%, and year-to-date it’s up over 7%. Even as a long-term investor with a clear strategy and timeline, you may get caught up in the game of “what-ifs.” What if you became more defensive (would you lose less)? What if you invested more aggressively (would you make more)? There are a million ways to invest for short-term gain. Most of them don’t work, leaving investors on ground that has already shifted.
Figure 3 (above) represents the alternative: investing for the long-term without emotional attachment. It reflects a 97-year track record, showing that markets will continue to rise despite painful and unpredictable setbacks. It shows that markets are resilient, responsive, and forward-looking.
If your allocations have become misaligned with your risk tolerance, timeline or goals, then it makes sense to revisit your portfolio and rebalance as needed. But it doesn’t make sense to adjust your portfolio based on hope or fear (or stress or anxiety). We can’t know what will happen next. Being at peace with uncertainty is a core attribute of the successful investor. And it’s a good way to live overall.
Now let’s take a quick look at recent market data.
February Market Review
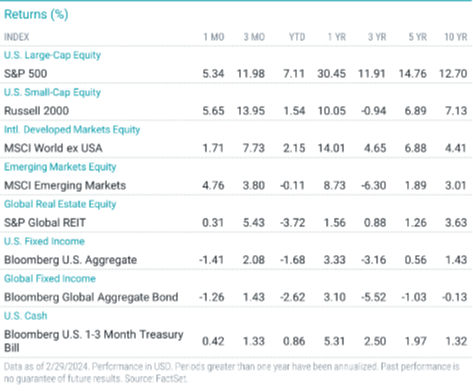
Broad U.S. stock indices rallied to record highs in February. Stocks in non-U.S. developed markets advanced but lagged the U.S. average. Emerging market stocks underperformed U.S. stocks, but outperformed non-U.S. developed market stocks.
Inflation remains a closely watched indicator, and February data was a disappointment. Prices rose 0.4% from January to February, higher than the previous month’s figure of 0.3%, according to the Labor Department. Compared with a year earlier, consumer prices rose 3.2% in February, slightly higher than January’s 3.1% annual pace.
Excluding volatile food and energy prices, “core” prices, an important measure of where inflation may be headed, also climbed 0.4% from January to February, matching the previous month’s rise. Inflation inched lower in Europe in February but remained above the central bank’s target.
U.S. Treasury yields rose for the month, and the broad bond market declined.
U.S. Stocks
The S&P 500 Index advanced for the fourth consecutive month, returning 5.34% in February and reaching a new record high on better-than-expected fourth-quarter earnings. Propelled by strength in the artificial intelligence industry, notably NVIDIA’s record fourth-quarter results, the Nasdaq Composite also reached a record high.
All S&P 500 Index sectors rallied for the month, led by consumer discretionary and industrials. The utilities sector posted the smallest gain.
U.S. stocks broadly advanced in February and year to date (YTD), and outperformed non-U.S. stocks.
Small-cap stocks modestly outperformed large-caps in February. Large-caps maintained a significant YTD advantage, returning 6.9% compared with 1.5% for small-caps.
Growth stocks sharply outperformed value stocks for the month and YTD. In February, small-cap growth stocks led all other categories, but large-cap growth stocks were top performers YTD.
International Stocks
The broad international developed-market stock index advanced in February and YTD.
Large-cap stocks rose 1.9% in February and outperformed small-caps, which were up fractionally. Large-caps gained 2.6% YTD, while small-cap stocks declined 1.4%.
Large-cap growth stocks were top performers the month and YTD, while small-cap value stocks lagged.
Emerging Market Stocks
Emerging market stocks rallied and outperformed non-U.S. developed markets stocks in February. Emerging market stocks were nearly flat YTD.
Large-cap emerging market stocks outperformed small-caps in February but underperformed small-caps YTD.
Emerging market growth stocks outperformed value stocks across capitalizations, but value stocks were the top performers YTD.
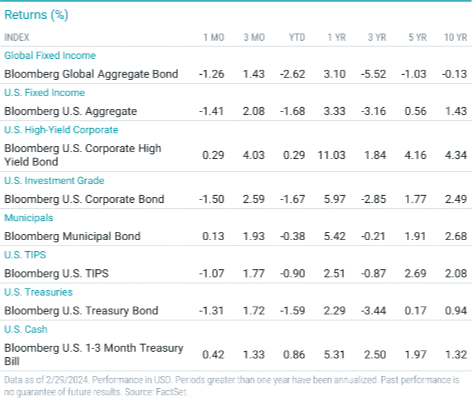
Fixed-Income Returns
Persistent inflation news caused Treasury yields to rise in February. Investment-grade bonds posted a negative return for the month.
The Bloomberg U.S. Aggregate Bond Index returned -1.41% in February. All index sectors declined, led by MBS and corporate bonds. Treasuries declined but outperformed the broad investment-grade index.
The 10-year Treasury yield ended February at 4.26%, 34 bps higher than it was at the end of January. The two-year Treasury yield jumped 42 bps to 4.63%.
Investment-grade credit spreads ended the month nearly flat, while high-yield spreads tightened approximately 30 bps.
Market expectations for Fed rate cuts shifted. By the end of February, the futures market, which previously expected the first rate cut to arrive in March, pushed back its forecast to June. It also reduced its 2024 outlook from six to three rate cuts.
Core CPI remained unchanged at 3.9%, with the shelter component still driving the gain. The annual core PCE price index, the Fed’s preferred inflation gauge, inched down to 2.8% from 2.9% in December.
Municipal bonds advanced modestly and outperformed Treasuries.
TIPS declined but outperformed nominal Treasuries.
Do you have questions about your portfolio, asset allocation, or some aspect of your financial plan? Call us. We are here to help.
Regards,
John Gorlow
President
Cardiff Park Advisors
888.332.2238 Toll Free
760.635.7526 Direct
760.271.6311 Cell