John Gorlow
| May 17, 2024

In weather, an inversion layer is an odd phenomenon in which warm air pushes cold air to the ground, resulting in trapped smog and unsettled conditions. In finance, an inverted yield curve is a similarly odd disturbance. When investors demand higher yields (or interest) for holding short-term U.S. debt than they do for holding long-term debt, something is decidedly off-kilter. Common wisdom says that an inverted yield curve signals a recession. But so far, the pattern is not unfolding as predicted.
At 777 days and counting, we are experiencing the longest sustained inverted yield curve since 1976. The current inversion began in April 2022 and was marked by a major reversal of policy for the Fed, which had kept its benchmark interest rate at close to zero as recently as the first quarter of 2022. Then the Fed raised interest rates seven times that year, and the stock and bond markets staged spectacular nose-dives. But after a rally in late 2022, equity markets went on to reward investors with handsome gains.
When a pattern doesn’t repeat as predicted, it’s time to look for new clues. One possibility for the inverted yield curve can be found in supply and demand for U.S. government debt. The issuance of government debt skyrocketed in 2020, when Covid-19 posed a global economic threat. Many believed that the U.S. Treasury had been too slow to act during the Great Financial Crisis of 2007 – 2008, making the recession worse than it might have been. This time, Treasury was intent on getting ahead of the meltdown.
Since the beginning of 2020, government-issued debt has grown more than 60% to $27 trillion. But the make-up of that debt changed greatly after the yield curve inverted in 2022. In 2021, the net issuance of short-term Treasuries (T-bills, maturing in 1 year or less) was sharply negative, as the Treasury retired old bills without reissuing new ones. At the same time, longer-term note issuance (T-notes, maturing in 2-10 and 20-30 years) was net positive. That shifted over the last year and a half, when short-term debt dominated new issuance, accounting for 84% in 2023 and 67% so far in 2024.
Some believe that this much greater supply of short-term issuance flipped the yield curve, as investors demanded a higher premium to absorb it. Another possible explanation: investors may not be demanding higher premiums to hold long-term bonds because they do not want to shoulder the duration risk if rates go up. No one wants to be left holding the bag.
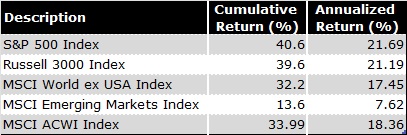
We don’t always understand why yield curves break from normal patterns, or why the current pattern has persisted longer than usual. We do know, generally, that inverted yield curves reflect deteriorating investor sentiment and expectations for a decline in longer-term interest rates, typically associated with recessions. And it’s true that inverted yield curves were harbingers of recessions in 2020, 2009, 2001, and all others back to 1960. In the current case, if a recession does follow, it will have had an unusually long on-ramp. And that has confounded many analysts and investors. If an investor dumped equities when the current yield curve inverted on July 6, 2022, it would have been a costly decision, as illustrated in the chart below. (Avantis Investors, April 2024)
A Bigger Problem On Our Doorstep
As noted above, inverted yield curves reflect declining investor confidence. What might investors be concerned about? Looking back to the financial crisis of 2007-2008, regulators tightened the screws on banks and financial institutions to sweep reckless risk from the system. At the same time, the system was flooded with cheap money in order to prevent total collapse. The Federal Funds rates rose higher than 2% on just a few occasions from 2008 through mid-2022, skittering along at 1% or less for years at a time. All that money flooding the system resulted in an unprecedented surge in debt.
America’s net debt has now reached 96% of GDP. And the federal deficit is nearly twice the average of other developed economies, averaging 9% of GDP per year for the past 5 years. As the national debt has grown exponentially it has fed the nation’s economic expansion. But it also has reinforced higher interest rates needed to temper stubborn inflation. Elevated rates have caused government financing costs to skyrocket, absorbing more of this year's fiscal budget than defense spending. Over the next two decades, financing costs alone are projected to make up two-thirds of the federal budget deficit. And the debt-to-GDP ratio is expected to rise from the current 96% to a staggering 166% over the next three decades.
You don’t need an MBA to understand that this scale of borrowing is unsustainable. Just as high interest on maxed-out credit cards clamps down spending and makes repayment almost impossible for the average Joe, government debt will have the same effect on the American economy. The U.S. government must find borrowers for about $10 trillion in bonds this year alone in order to roll over current debt and finance the surge of debt to come. And as the scale of bond auctions grows, so does the potential for turbulence in the Treasury market, which could threaten the global financial system. And so we find ourselves between a rock and a hard place. The only viable solution for offloading all that debt is higher yields, which in turn will feed ever-higher debt. This cycle is likely to continue absent some serious belt-tightening.
As many pundits have pointed out, this puts the American economy in unprecedented and potentially dangerous territory. High financing costs will drag down investment, suffocate consumer demand, and squeeze spending on everything from retiree benefits to investment in schools, infrastructure, research, and more. Slower growth is inevitable under this scenario.
You aren’t likely to see political candidates or elected officials of either party address this issue. When one does occasionally bring up cost-cutting, he or she is jeered off the stage or booted from office. No one wants to give anything up, and no one wants to hear about higher taxes. And yet even the most ardent consumer of goods and benefits understands the meaning of a maxed-out credit card or depleted savings account.
Various things could save us, including a surge of innovative growth or collaborative work across the political aisle to reduce costs and deliver a balanced budget. Meanwhile the inverted yield curve is sending us an unsettled message.
Of course it is impossible (and undesirable) to time investments according to perceived risk. As fiduciaries, our role at Cardiff Park is to help our clients take appropriate, measured risks to achieve their goals and meet their obligations. Our portfolios align individual risk capacity and tolerance with a long-term strategy. While the idea of mitigating short-term risk to achieve long term gains is not a new one, doing it thoughtfully and without emotional attachment is key.
Now let’s take a quick look at April market data.
April Market Snapshot
Courtesy of Avantis Investors
Both U.S. and global stocks snapped a five-month winning streak in April, as most major indices declined. Bond returns also declined amid inflation pressures and rising Treasury yields.
The S&P 500 Index fell 4% in April, its first monthly decline since October, dropping its year-to-date (YTD) gain to 6%.
All S&P 500 sectors declined in April, with the exception of utilities, which gained nearly 2%. The real estate sector was the weakest, falling more than 8%.
Non-U.S. developed market stocks declined, but fared better than U.S. stocks in April. They advanced YTD, but lagged U.S. stocks. Emerging market stocks posted a slight gain for the month and outperformed non-U.S. developed market stocks YTD.
The annual U.S. headline inflation rate rose to 3.5% in March, a six-month high, while core inflation remained unchanged at 3.8%. Core inflation eased in the eurozone and the U.K. but remained above target levels.
The futures market continued to scale back its expectations for Fed rate cuts in 2024 ahead of the Fed’s May 1 monetary policy announcement. The European Central Bank held rates steady at its April meeting.
All size and style indices declined for the month. Large-cap stocks outpaced their smaller peers. Value slightly underperformed growth among large-caps but outperformed in small-caps.
U.S. Treasury yields surged in April, and the broad bond market declined.
Equity Returns
U.S.
U.S. stocks retreated in April, but most indices maintained solid YTD gains. U.S. stocks lagged their non-U.S. peers for the month but outperformed YTD.
Large-cap stocks declined in April but outpaced small-caps, which fell 7%. Year to date, large-caps gained nearly 6%, while small-caps declined 2%.
In April, value stocks outpaced growth stocks among small-caps but lagged slightly among large-caps. YTD, growth stocks retained a performance advantage across the board.
Non-U.S. International Developed
International developed markets stocks declined but outperformed U.S. stocks in April. They lagged U.S. stocks YTD.
Large-cap stocks outperformed small-caps in April. YTD, large-caps gained more than 3%, while small-caps declined 0.4%.
Value stocks fared better than their growth-style peers across the board in April. YTD, value and growth stocks performed similarly among large-caps, and value outperformed in the small-cap arena.
Emerging Markets
The broad emerging market index advanced modestly in April and outperformed developed markets. Emerging market stocks gained nearly 3% YTD.
Small-cap stocks outperformed large-caps in April. YTD, large-caps outpaced their small-cap peers.
Value stocks outperformed growth stocks in April, most notably among small-caps. YTD, growth stocks outperformed in the large-cap arena, but lagged their value-style peers among small-caps.
Fixed-Income Returns
U.S. bonds broadly retreated in April. Amid persistent inflation and changing expectations for Fed rate cuts, Treasury yields rose.
The Bloomberg U.S. Aggregate Bond Index returned negative 2.53% in April, as all sectors declined. April’s loss pushed the index’s YTD return to negative 3.28%.
Treasury yields soared for the month, with the 10-year note climbing 48 bps to 4.69%. The two-year Treasury yield jumped 42 bps to 5.05%, and the yield curve remained inverted.
Credit spreads tightened slightly, but corporate bonds underperformed Treasuries. MBS also underperformed Treasuries. High-yield corporates declined but outperformed investment-grade corporates.
The headline inflation rate rose to 3.5% (year-over-year) in March, up from 3.2% in February. Core CPI increased 3.8% (year-over-year), unchanged from February.
Core Personal Consumption Expenditures (PCE), the Fed’s preferred gauge, also remained unchanged in March at 2.8%.
With inflation remaining firm, markets recalibrated their expectations for Fed rate cuts. By the end of April, the futures market priced in only one Fed rate cut for the year — a 25-bps cut in November.
Municipal bonds declined for the month but outperformed Treasuries.
Inflation expectations increased in April, and TIPS outperformed nominal Treasuries.
Do you have questions about your portfolio? If so, please contact us. We are here to help.
Regards,
John Gorlow
President
Cardiff Park Advisors
888.332.2238 Toll Free
760.635.7526 Direct
760.271.6311 Cell