John Gorlow
| Jul 18, 2024

It was a great first half of 2024 for stocks. The S&P 500 reached record territory, climbing about 15% from January through June. Investors were cheered by a slowdown in inflation, disappointed that the Fed didn’t begin rate cuts, and dazzled by the glittering potential of AI. The AI chipmaker Nvidia rose an astounding 150% in six months, briefly becoming the most valuable company on the planet.
Joe Rennison observes that markets have felt “tranquil” through mid-year, with the benchmark S&P 500 index only once gaining or losing more than 2% in one day (New York Times, 28-June 2024). The volatility index, often a harbinger of rocky times, also has been low. All this is pretty good news, right?
But beneath this smooth surface, Rennison and others see turbulence. “More than 200 companies, or roughly 40 percent of the stocks in the index, are at least 10 percent below their highest level of this year. Almost 300 companies, or roughly 60 percent of the index, are more than 10 percent above their low for the year. And each group includes 65 companies that have actually swung both ways.”
The financial press has been quick to point out this “dispersion,” a measure of how widely returns of individual stocks differ from the average. But some analysts, including those at DFA, do not see current dispersion as being far outside the norm. So why is it on the radar at all? One reason could be that big tech has so distorted the S&P 500 index that investors want a handle on how everyone else is doing.
In theory, dispersion should aid active portfolio managers in their quest to pick stock winners and losers. But that hasn’t been the case. In fact, active stock pickers have performed worse than usual so far this year, reports Jason Zweig (WSJ, 5-July 2024). “In the first half of 2024, according to Morningstar, only 18.2% of actively managed mutual funds and exchange-traded funds that compare themselves to the S&P 500 managed to outperform it. That’s down from 19.2% in the first half of last year and 19.8% in all of 2023.”
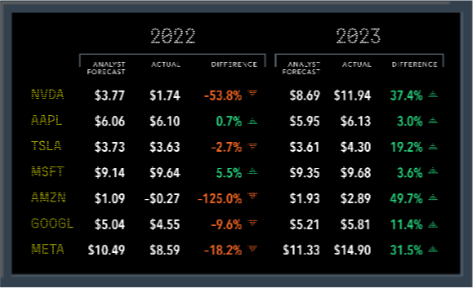
If the most highly paid stock-pickers can’t get it right, some investors may be tempted to invest heavily in the so-called “Magnificent 7,” leading to a dangerously undiversified portfolio. Wes Crill of DFA (20-June 2024) writes that “It is unlikely that any stock has an expected return of 100% per year…. But the Magnificent 7 returned on average more than 111% in 2023, exceeding the S&P index by over 85 percentage points.” Those huge gains can be attributed to the fact that these stocks “surprised investors in a good way.” But here’s the rub: Expecting continued outperformance is “to continue to bet on these companies further exceeding the market’s expectations.” To understand how expectations can jack up returns, consider the chart below.
Magnificent 7 actual vs. analyst forecast earnings per share, 2022–2023
What could derail the tech-heavy gravy train? Slower growth. Stubborn inflation that further delays rate cuts. A reduced appetite for AI chips. And if the tech-heavies falter, they could drag down the rest of the market, as information technology currently accounts for about 35% of the S&P 500 index.
Markets are fickle and can change overnight. Shifts in consumer demand, technological advancements, competition, and regulatory changes can all affect the fortunes of even the best companies. High-flyers get knocked off their pedestals. Stealth players rise. And sectors that have languished can suddenly soar. For example, the small-cap Russell 2000 index has outperformed the Nasdaq Composite by about 11% over the past five trading days, the largest degree of outperformance since 2000 (Dow Jones Market Data). Over the same five days it has outperformed the S&P 500 by about 10 percentage points, breaking a five-day record going back to 1986.
It's a good reminder that anything can happen. In fact, passive investors count on the unexpected. It’s the reason to have a well-constructed financial plan, enough liquidity to ride out turbulence, and a long-term perspective to help you reach your financial goals through diversification, tax-efficient investing, and an appropriate mix of stocks and fixed income solutions positioned across a range of asset classes. In short, to be prepared for however markets pivot next.
We believe there is never a good time to embrace unnecessary risk (i.e., uncompensated forms of expected returns), even when a stock or group of stocks is on a glory ride. Likewise, there is no good time to turn away from necessary risk (i.e., compensated forms of expected returns) in pursuit of your goals. The market doesn’t care, but your passive investment strategy can and will make a difference in outcomes over time.
Now let’s take a quick look at Q2 market performance.
Q2 Market Review
Courtesy of Avantis Investors
U.S. stocks advanced for the second quarter, outperforming non-U.S. developed market stocks but lagging emerging markets. Meanwhile, inflation moderated, economic data remained generally healthy, and bond returns were essentially flat.
Amid persistent inflation and renewed expectations for Fed rate cuts, the S&P 500 Index logged its second consecutive quarterly gain. Solid monthly returns in May and June offset April’s decline, and the index advanced 4.3% for the quarter.
S&P 500 sector performance was mixed in June and for the quarter. Information technology was the top sector for both periods. The utilities sector was the main laggard in June, while materials was the weakest sector in Q2.
Non-U.S. developed markets stocks declined for the month and quarter. Emerging market stocks advanced and outperformed U.S. stocks for the month and quarter.
The Fed held rates steady in June. The European Central Bank cut three key rates in June, while the Bank of England left its target rate unchanged.
Annual U.S. headline inflation eased to 3.3% in May from 3.4% in April. Inflation slowed to 2.5% in Europe and 2% in the U.K.
In the U.S., large-cap stocks advanced in June and for the quarter, outperforming small-caps, which declined. Growth stocks outpaced value stocks across capitalizations. Outside the U.S., most size and style indices for developed markets declined for the month, but they all gained for the quarter.
U.S. Treasury yields declined for the month but rose for the quarter. The broad bond market gained nearly 1% in June and 0.1% for the quarter.
U.S. Stocks (63% of Global Market Cap)
The U.S. equity market posted positive returns for the quarter, outperforming non-U.S. developed markets but underperforming emerging markets.
Value underperformed growth.
Small caps underperformed large caps.
REIT indices underperformed equity market indices.
Non-U.S. Developed Markets (26% of Global Market Cap)
Developed markets outside of the U.S. posted negative returns for the quarter and underperformed both U.S. and emerging markets.
Value outperformed growth.
Small caps underperformed large caps.
Emerging Markets (11% of Global Market Cap)
Emerging markets posted positive returns for the quarter and outperformed both U.S. and non-U.S. developed markets.
Value outperformed growth.
Small caps outperformed large caps.
Fixed Income
Against a backdrop of persistent though slowing inflation, generally positive economic data, and Fed policy uncertainty, interest rates generally increased in the U.S. Treasury market for the quarter.
The Fed held its target lending rate steady, waiting for more evidence that inflation is on a sustainable slowdown. At the June policy meeting, Fed officials hinted at one rate cut later this year, down from their December 2023 outlook for three rate cuts.
Headline CPI slowed to an annualized pace of 3.3% in May, down from 3.4% in April. Annual core CPI slowed to 3.4%, compared with 3.6% in April. Annual core PCE, the Fed’s preferred inflation gauge, slowed to 2.6% in May from 2.8% in April.
On the short end of the yield curve, the 1-Year U.S. Treasury Bill yield increased 6 bps to +5.09%. The yield on the 2-Year U.S. Treasury Note increased 12 bps to +4.71%.
Further out the curve, the yield on the 5-Year U.S. Treasury Note increased 12 bps to +4.33%. The yield on the 10-Year U.S. Treasury Note increased 16 bps to +4.36%. The yield on the 30-Year U.S. Treasury Bond increased 17 bps to +4.51%.
In terms of total returns, short-term U.S. Treasury bonds returned +0.77% while intermediate-term U.S. Treasury bonds returned +0.58%. Short-term corporate bonds returned +0.96% and intermediate-term corporate bonds returned +0.74%.
The total returns for short- and intermediate-term municipal bonds were +0.35% and -0.92%, respectively. Within the municipal fixed income market, general obligation bonds returned -0.30% while revenue bonds returned +0.07%.
Do you have questions about your portfolio? If so, please contact us. We are here to help.
Regards,
John Gorlow
President
Cardiff Park Advisors
888.332.2238 Toll Free
760.635.7526 Direct
760.271.6311 Cell